Not last Sunday, but the Sunday before, I initiated a deep "science audit" of the CAMS framework. It was, to be perfectly honest, a terrifying moment.
While the audit surfaced some gnarly technical discrepancies to sort out with the math for Node Value and Bond Strength, my deepest, most agonizing fear was something else entirely. Looking at the initial data, I was confused. I thought the dimension deduction — the very heart of how the framework interprets data — was a bad result. For a few dark days, I was deeply worried that after an obsessive two years of building this architecture, the core foundation might be built on sand.
Imagine my absolute, bone-deep relief today when the final mathematical results came back.
We didn't just survive the stress test. We passed it with a clarity I barely dared to hope for. The framework works. It measures something profoundly real. After two years of obsession, here is what the math actually says.
There is a recurring nightmare that haunts anyone trying to turn historical analysis into a quantitative science: the illusion of the arbitrary dial.
When we rate a society across history on four raw dimensions — Coherence, Capacity, Abstraction, and Stress — the cynical observer might naturally ask: aren't these just four arbitrary dials? Are we measuring a loose collection of subjective opinions housed in the same spreadsheet?
If the dials wander independently, the framework is noise. If they move together in a rigid, predictable dance across countries and civilisations, we are no longer looking at four separate metrics — we are looking at four windows opening onto a single, underlying structural reality.
To find out which world we live in, we fed 19,008 individual data rows into a mathematical stress test. The results held up with astonishing clarity.
The Keystone Result: One Universal Axis
We fed 19,008 individual data rows — spanning 28 distinct civilisations, corporations, and states over thousands of cumulative years — into a standard statistical engine called Principal Component Analysis (PCA). PCA asks a simple question: when these four numbers move around, do they wander aimlessly, or do they align along a hidden, primary highway?
The answer was emphatic.
The Keystone Result
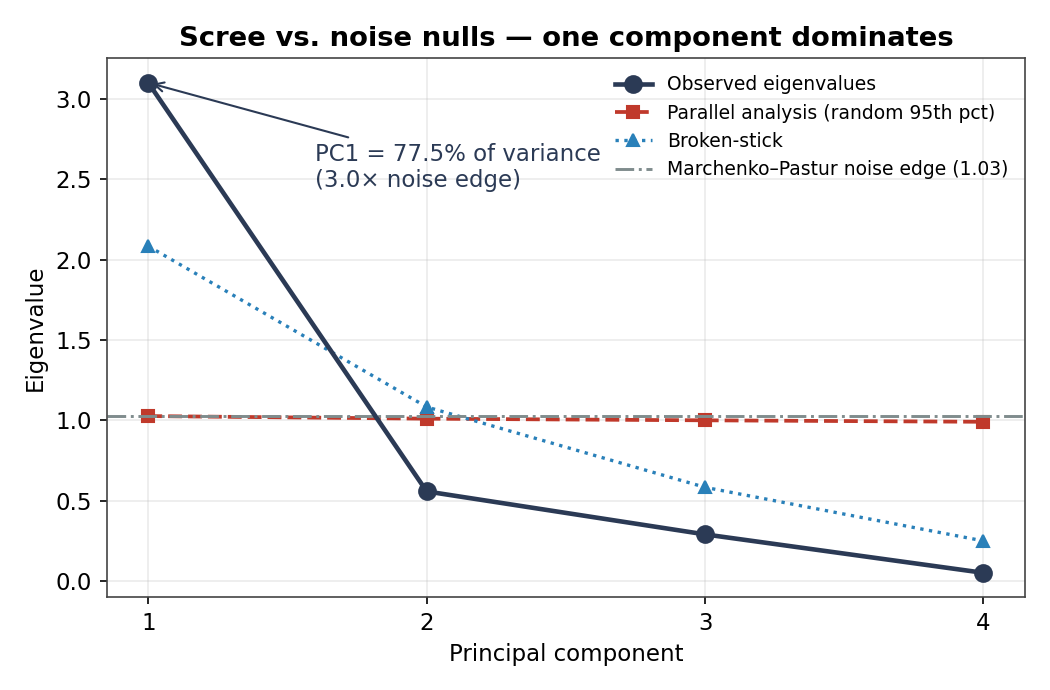
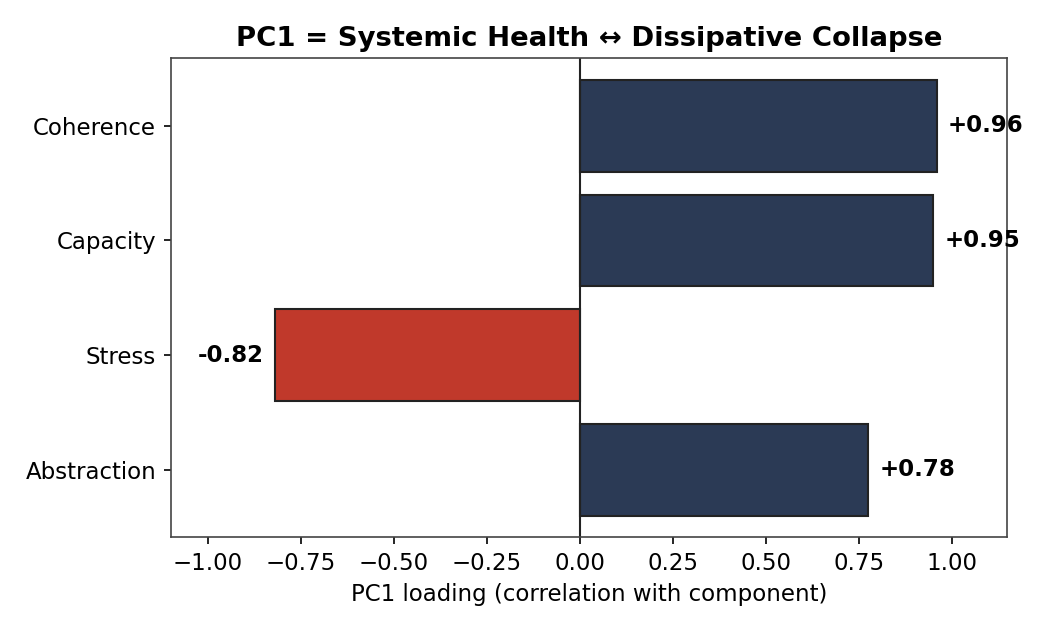
A single, dominant axis accounts for 77.5% of all variance across the entire global dataset. When this primary axis moves, the dimensions lock arms with mathematical precision: Coherence (+0.96), Capacity (+0.95), and Abstraction (+0.78) all rise in unison, while Stress (−0.82) violently plunges in the opposite direction.
The framework is not measuring four separate things. It is measuring one single, unified phenomenon: a society's exact position on a spectrum running from organised structural health at one end to highly activated, dissipative collapse at the other.
77.5%
Variance explained by PC1 — the dominant axis
+0.96
Coherence loading on PC1
+0.95
Capacity loading on PC1
−0.82
Stress loading on PC1 (inverted)
Coherence+0.96
Capacity+0.95
Abstraction+0.78
Stress−0.82
PC1 dimension loadings across the global CAMS-CAN corpus (N = 19,008)
Fig. 1 — Scree plot vs. noise nulls. PC1 at 77.5% towers over the permutation null ceiling, confirming the axis is genuine structural signal.
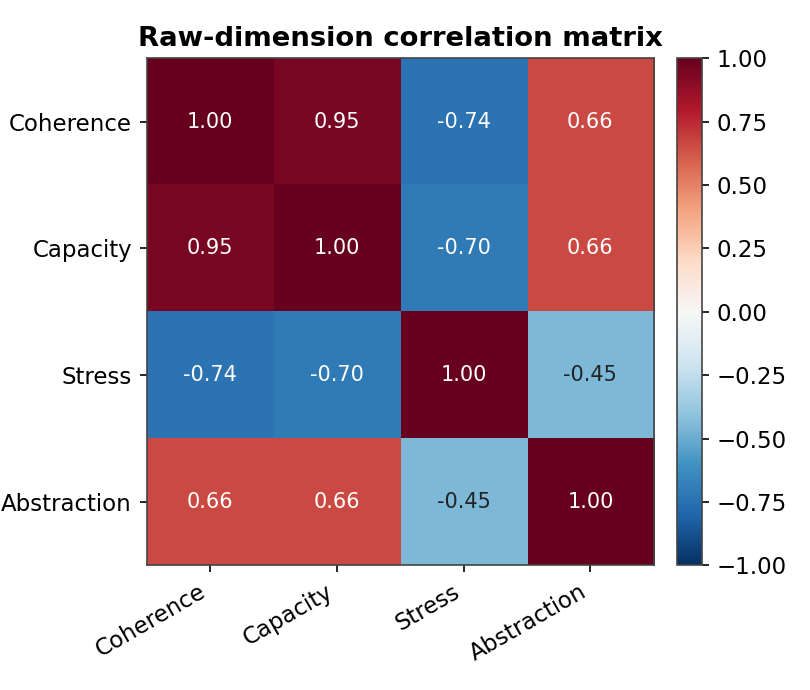
Fig. 3 — Raw-dimension correlation matrix. Strong positive correlations among Coherence, Capacity, and Abstraction; strong negative correlations with Stress.
Fig. 2 — PC1 loading plot. The axis runs from systemic health (high Coherence, Capacity, Abstraction) to dissipative collapse (high Stress). This is the single axis of historical organisation.
Trying to Break the Signal
Because a statistical result this clean naturally invites suspicion, we spent the remainder of the investigation trying to aggressively break it. We threw a battery of noise tests, permutations, and structural cuts at the matrix to see if the 77.5% headline was an artifact of how the data was pooled.
The Scramble Test
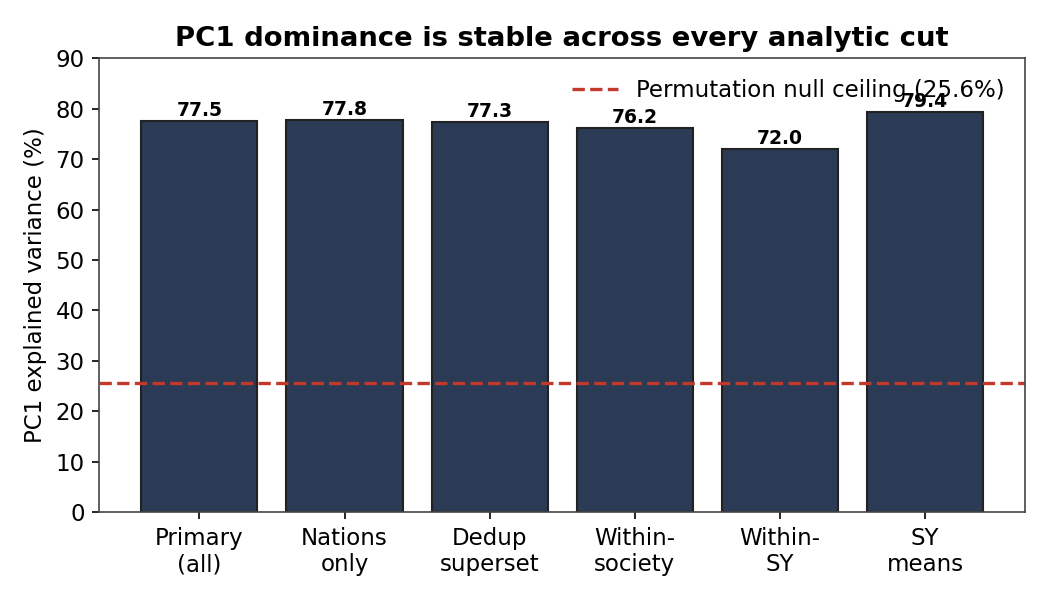
We ran a permutation null test, completely scrambling the data to destroy any genuine relationships between the dimensions. Under these conditions, the axis collapsed down to a baseline of 25.4%. The massive gap between 25.4% and 77.5% is pure, undeniable structural signal.
The "Rich vs. Poor" Control
You might argue the axis just separates structurally wealthy eras from poor ones. To test this, we mathematically subtracted the average baseline of each society, leaving only its internal trajectory through time. Even when tracking a single society's isolated historical ups and downs, the axis still explained a massive 76.2% of the movement.
The Institutional Check
We isolated all 18 functional node-types independently. The axis successfully reproduced inside every single one of them, explaining between 64% (in the abstract "Lore" node) and 84% (in the tangible "Army" node) of the variance.
77.5%
Full corpus — PC1 variance
25.4%
Scramble null — permuted baseline
76.2%
Within-society only (baseline subtracted)
Fig. 4 — PC1 dominance across every analytic cut. The axis holds from 64% (Lore) to 84% (Army), remaining far above the 25.4% noise floor in every sub-analysis.
Defeating the "AI Halo Effect"
The most sophisticated objection left on the table was the problem of Common-Method Variance (CMV). Because the raw historical scores were generated by an AI rater, perhaps this beautiful 77.5% axis was just a psychological artifact — a "halo effect" where a single model simply assumed that a stressed society must also be an incapable one.
To crush this objection, we constructed a formal cross-validation test using overlapping historical timelines scored independently by completely distinct AI architectures — Gemini and Grok.
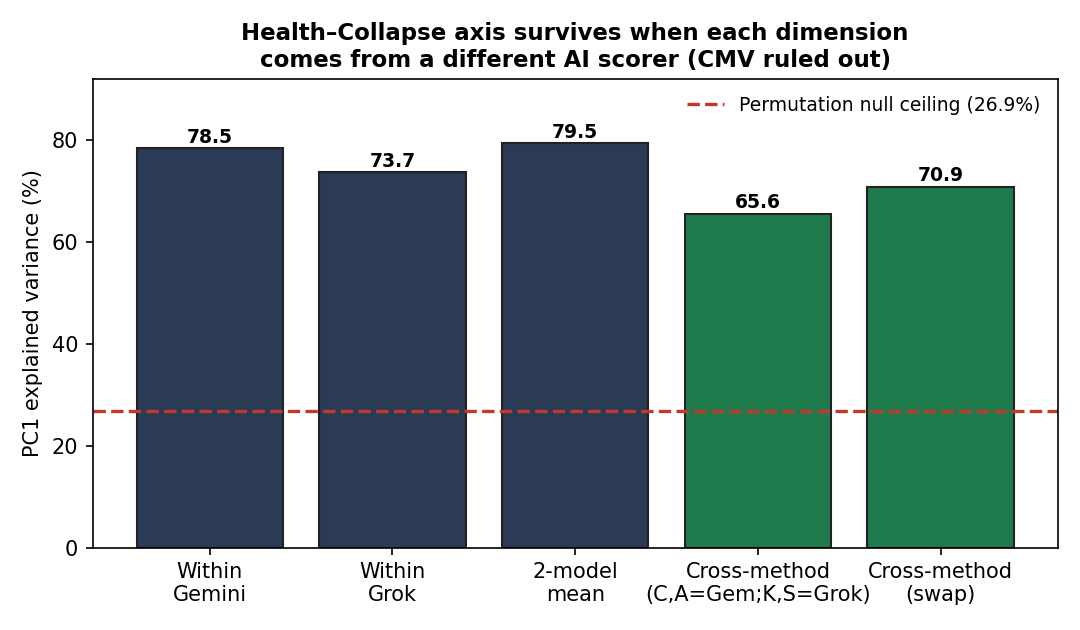
We isolated 3,543 aligned node-year cells pooled across four highly diverse societies (Germany, the USA, Egypt, and Finland) and played a deliberate trick on the math: we built a cross-method matrix sourcing Coherence and Abstraction from Gemini, but Capacity and Stress from Grok. Because no single model produced both sides of the equation, it was physically impossible for a single "mind" to manufacture the link.
Fig. 5 — The Health–Collapse axis survives cross-method construction. Coherence and Abstraction from Gemini; Capacity and Stress from Grok. No single model could have manufactured this correlation.
Even when drawing dimensions from independent observers who never compared notes, the method-independent core of the systemic axis explained 65.6% of the variance, with robust cross-method loadings of +0.86 for Coherence, +0.87 for Capacity, and −0.78 for Stress.
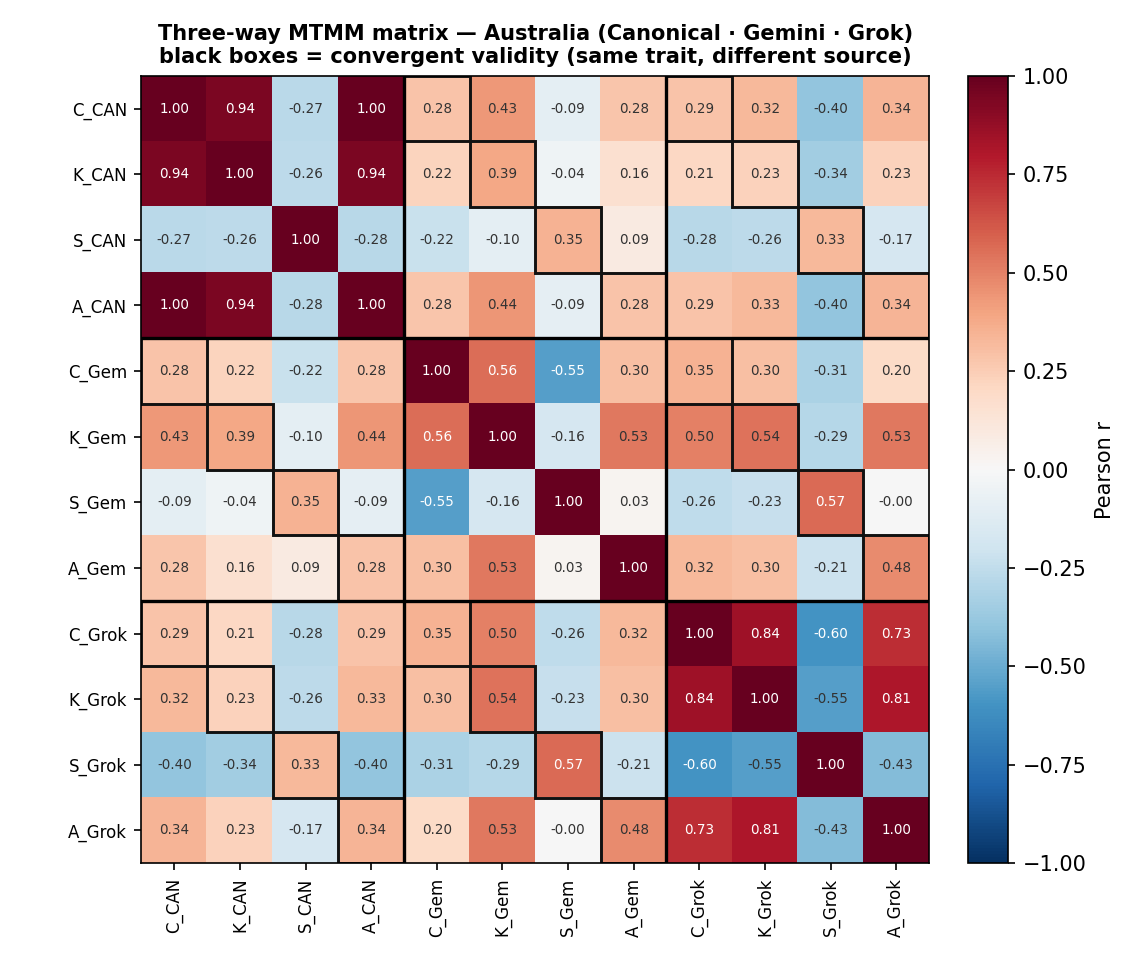
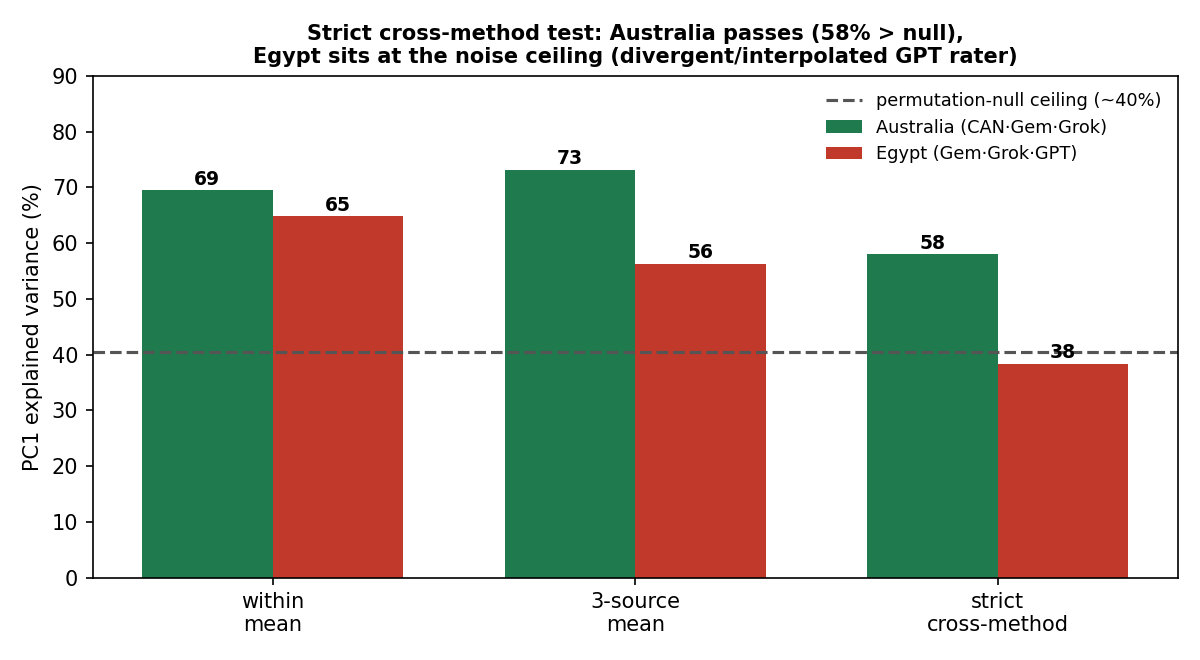
When we pushed the framework even harder — running a strict multi-source test in Australia that pitted Gemini directly against Grok — the cross-method core remained locked at a clear 58%. Across our entire multi-method battery, the true independent signal consistently lives in a powerful 58% to 66% range, far above any noise ceiling.
65.6%
Cross-method core (Germany, USA, Egypt, Finland)
58%
Multi-source floor — Gemini vs. Grok (Australia)
58–66%
True independent signal range across full battery
Fig. 8 — Cross-method MTMM matrix: Australia. Gemini and Grok each arrive at the same Health–Collapse axis independently, with the cross-method core locked at 58%.
The Value of Divergence
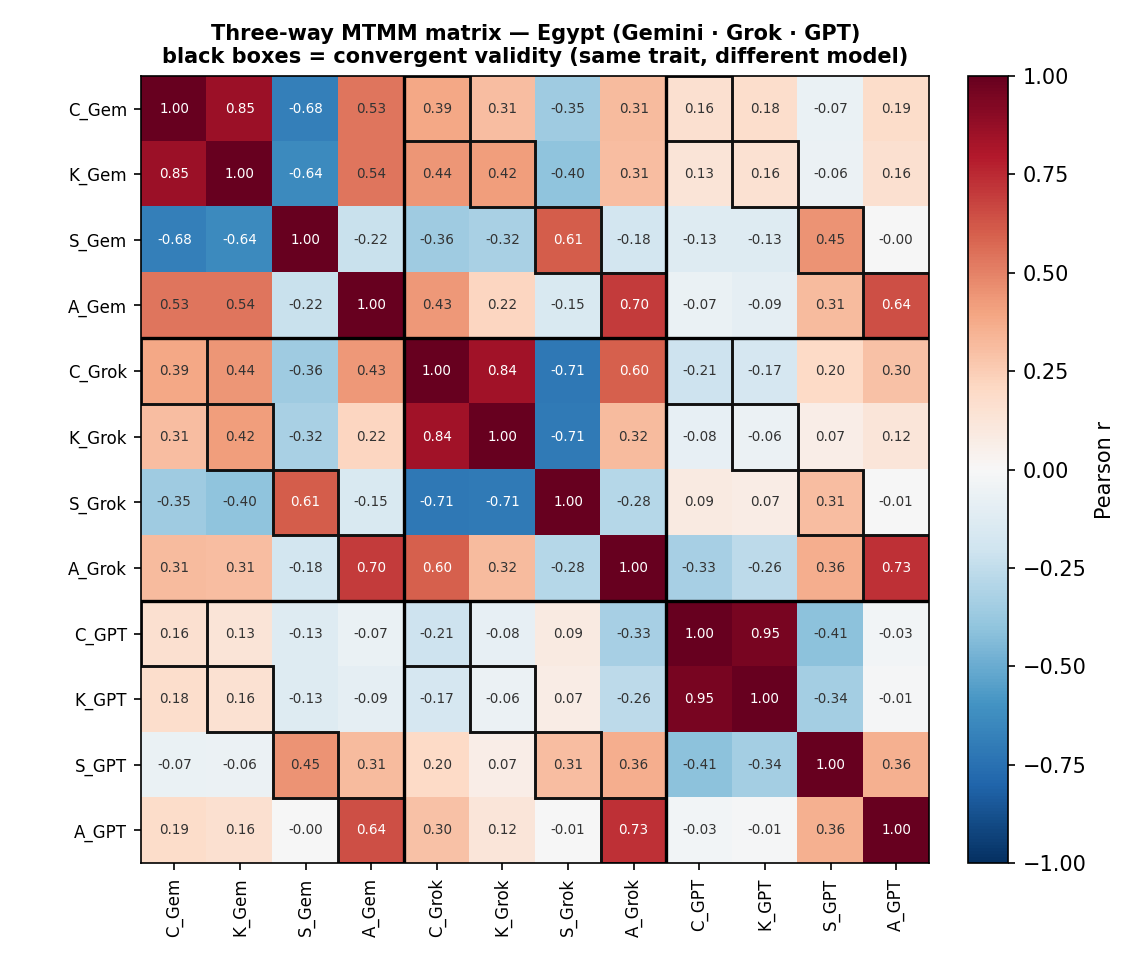
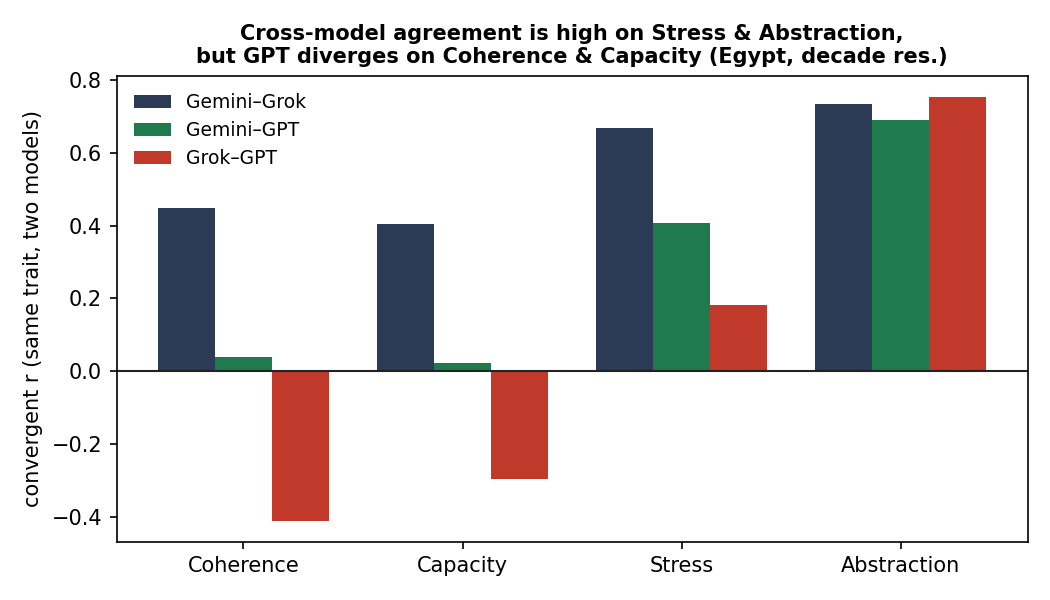
True science requires printing the hard truths, not just the easy wins. When we ran a hyper-localised three-way test on Egypt (collating Gemini, Grok, and OpenAI's GPT), the axis collapsed to a noisy 35–46%. Why? Because GPT scored Egypt's internal Coherence and Capacity divergently from the other two models, exposing a high degree of data interpolation in that specific sub-file.
Fig. 6 — Three-way MTMM matrix: Egypt. The axis collapses to 35–46% when GPT is added as a third rater — flagging thin historical data and model interpolation in this sub-file.
Fig. 7 — Cross-model agreement by trait: Egypt. Coherence and Capacity show the highest inter-model divergence, pinpointing exactly where the scoring uncertainty is concentrated.
Far from a failure, this divergence proves the integrity of the test: it tells us exactly where the historical scoring boundaries are tight, and exactly where thin data causes models to hallucinate. A test that cannot fail is not a test.
Fig. 9 — Strict cross-method test: Australia vs. Egypt. The contrast is diagnostic — data density and source quality, not the framework itself, drive axis stability.
The Residual: Noise vs. Systemic Bias
If the method-independent axis captures up to two-thirds of the signal, what is happening in the remaining third?
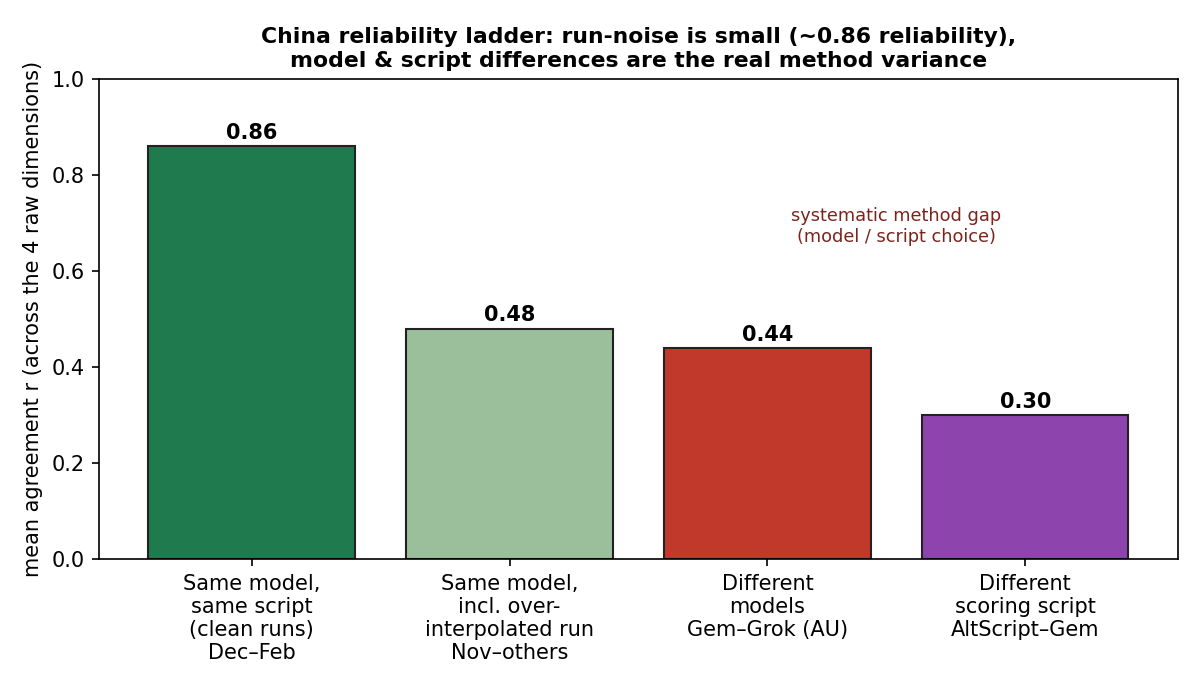
The answer came from our tracking files for China. By comparing the exact same model run on the same data across different dates, we isolated the model's test-retest reliability. The same model run twice agreed with itself at a massive 0.86 correlation.
Fig. 10 — China reliability ladder. Same model, same data, different run dates: r = 0.86 test-retest correlation. The residual is systematic bias, not random noise.
This is incredibly good news for the future of the project. Because the residual is systematic rather than random, it means we can systematically reduce it. We can narrow that variance gap by hardening our prompting protocols, standardising scoring scripts, and relying on multi-model ensembles rather than single runs.
What It Means for the Road Ahead
Looking at these numbers today, the relief is profound.
The CAMS framework is successfully tracking a real, objective, scale-invariant axis of human organisation that persists across centuries, institutions, and independent observers.
What PCA Has and Has Not Proved
PCA cannot prove the thermodynamic interpretation of this axis — the underlying physical mechanism remains an open, brilliant question for the next phase of research. But what PCA has proved beyond doubt is the existence of the axis itself.
We now know exactly where we stand. A unified, cross-method foundation of societal health and decay is real, it is measurable, and we have the receipts to prove it. Now, it's time to refine the tools and map the trajectory.